APM
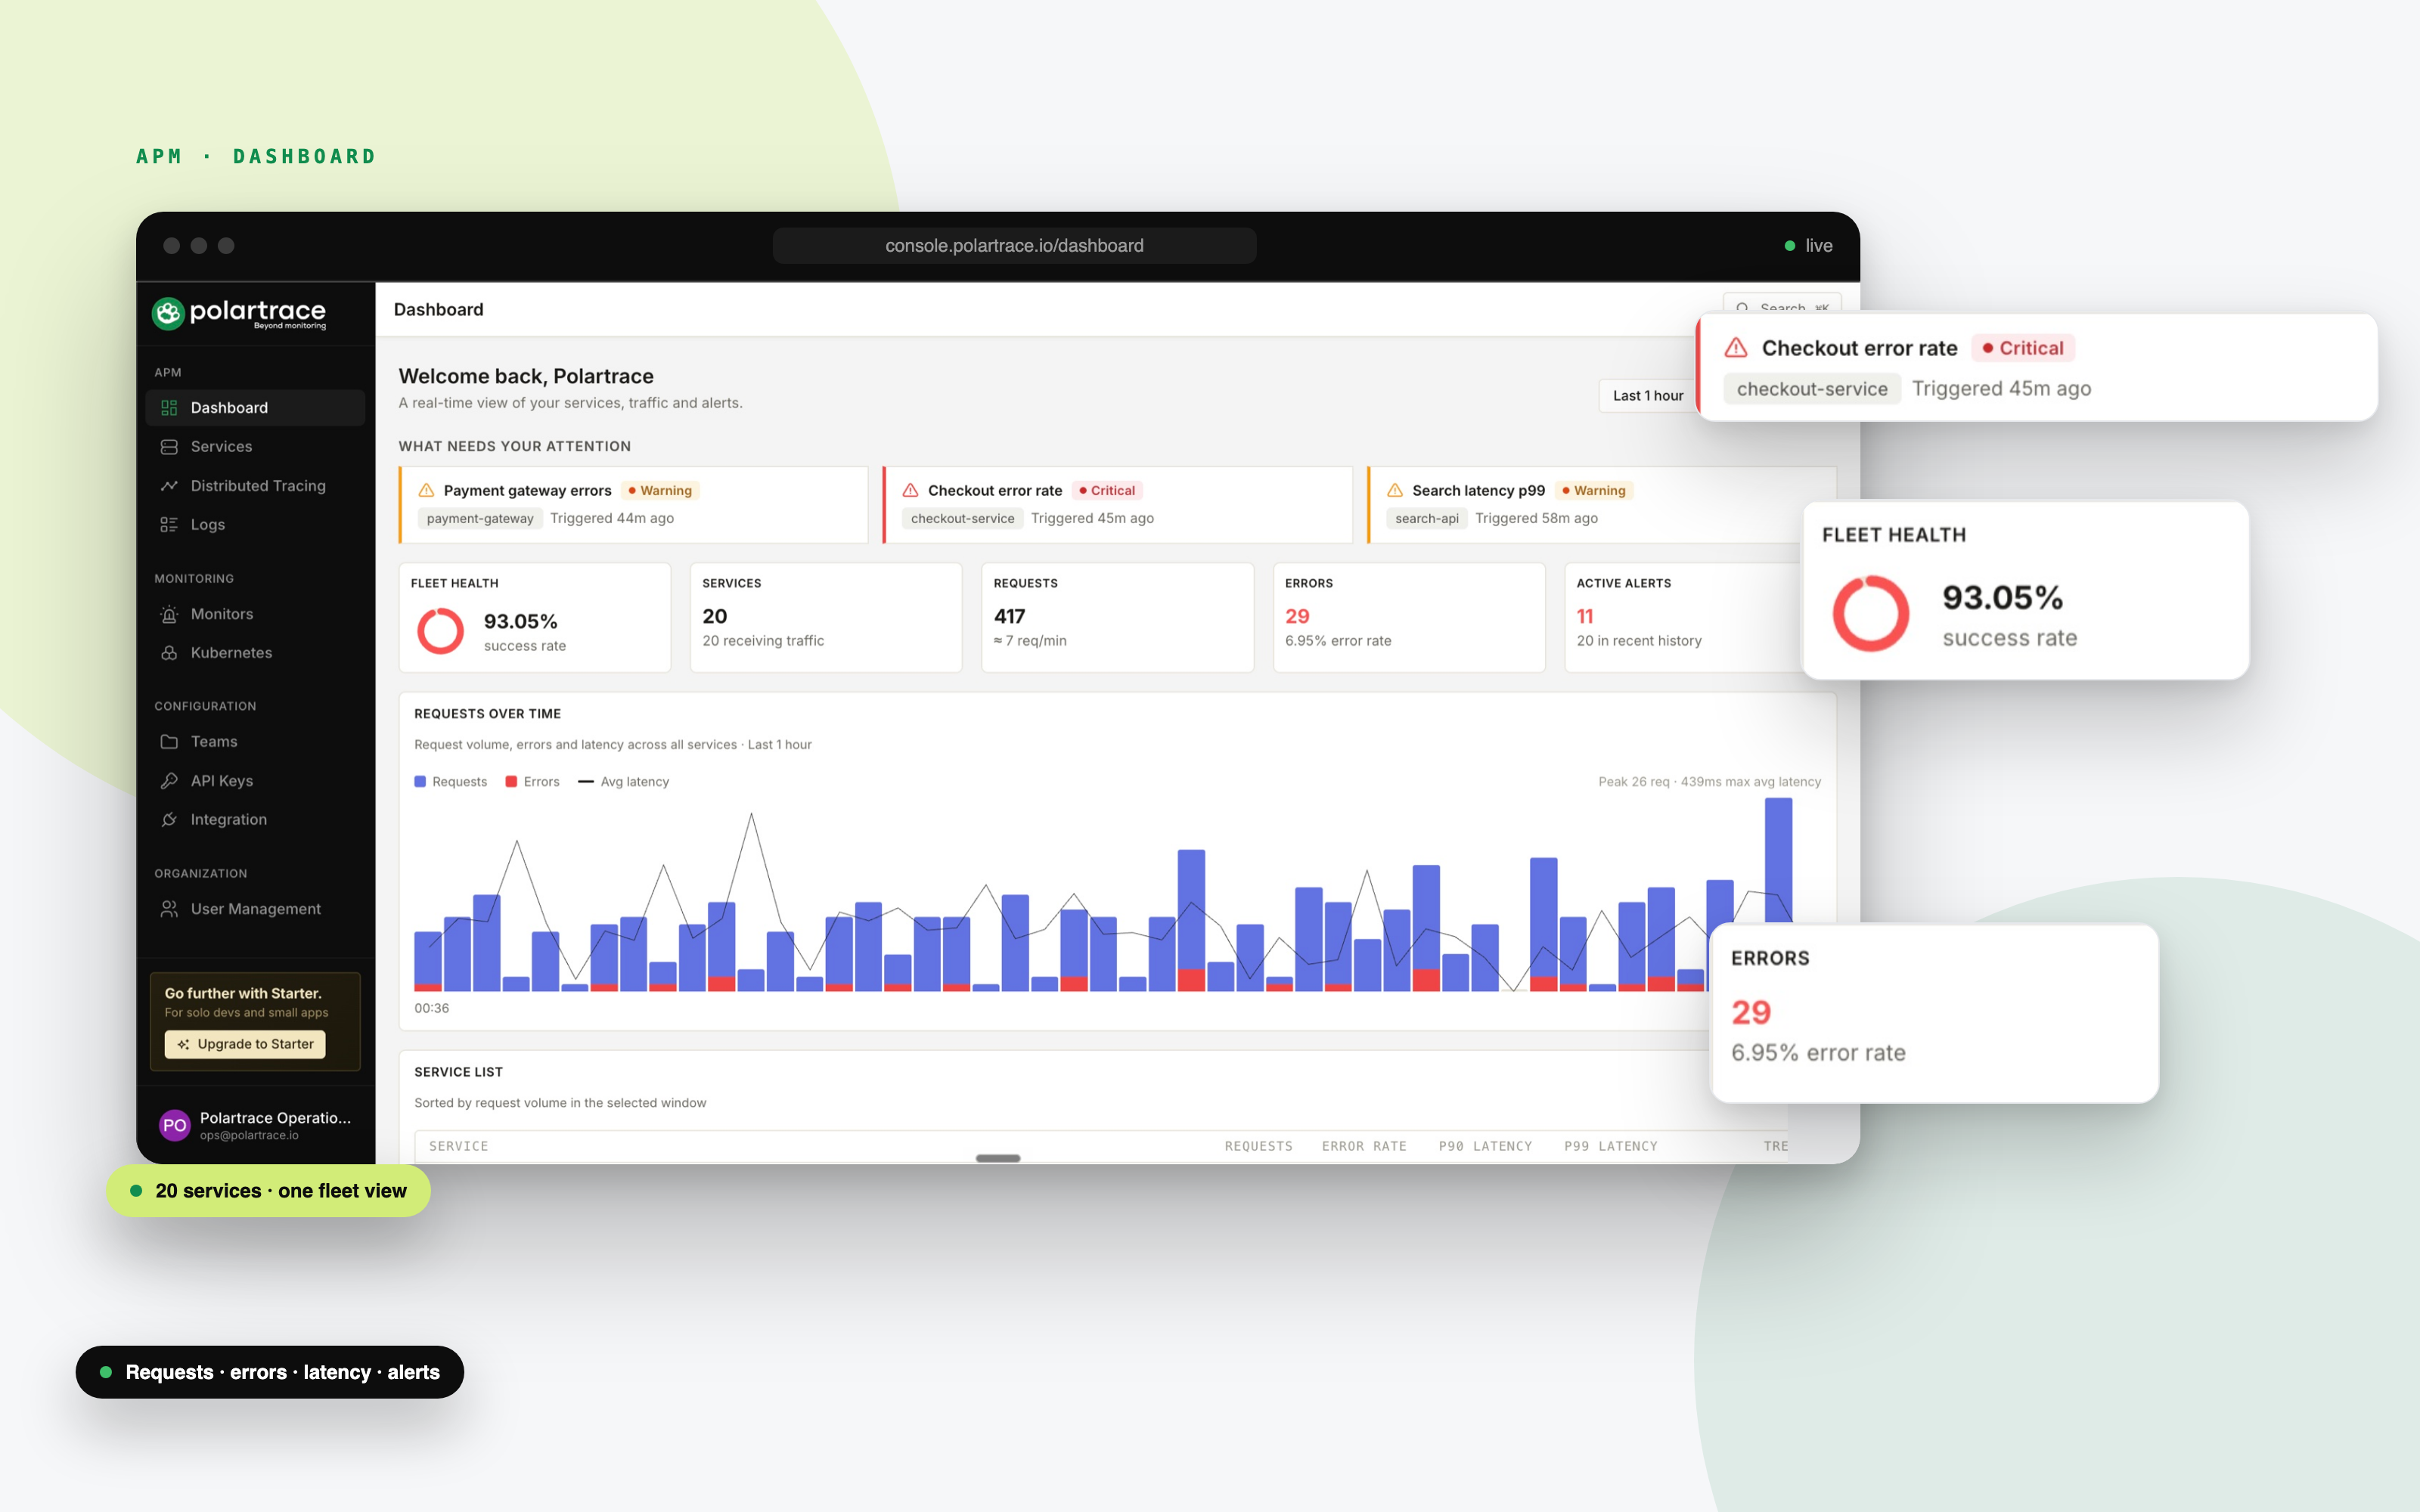
The whole fleet on one dashboard.
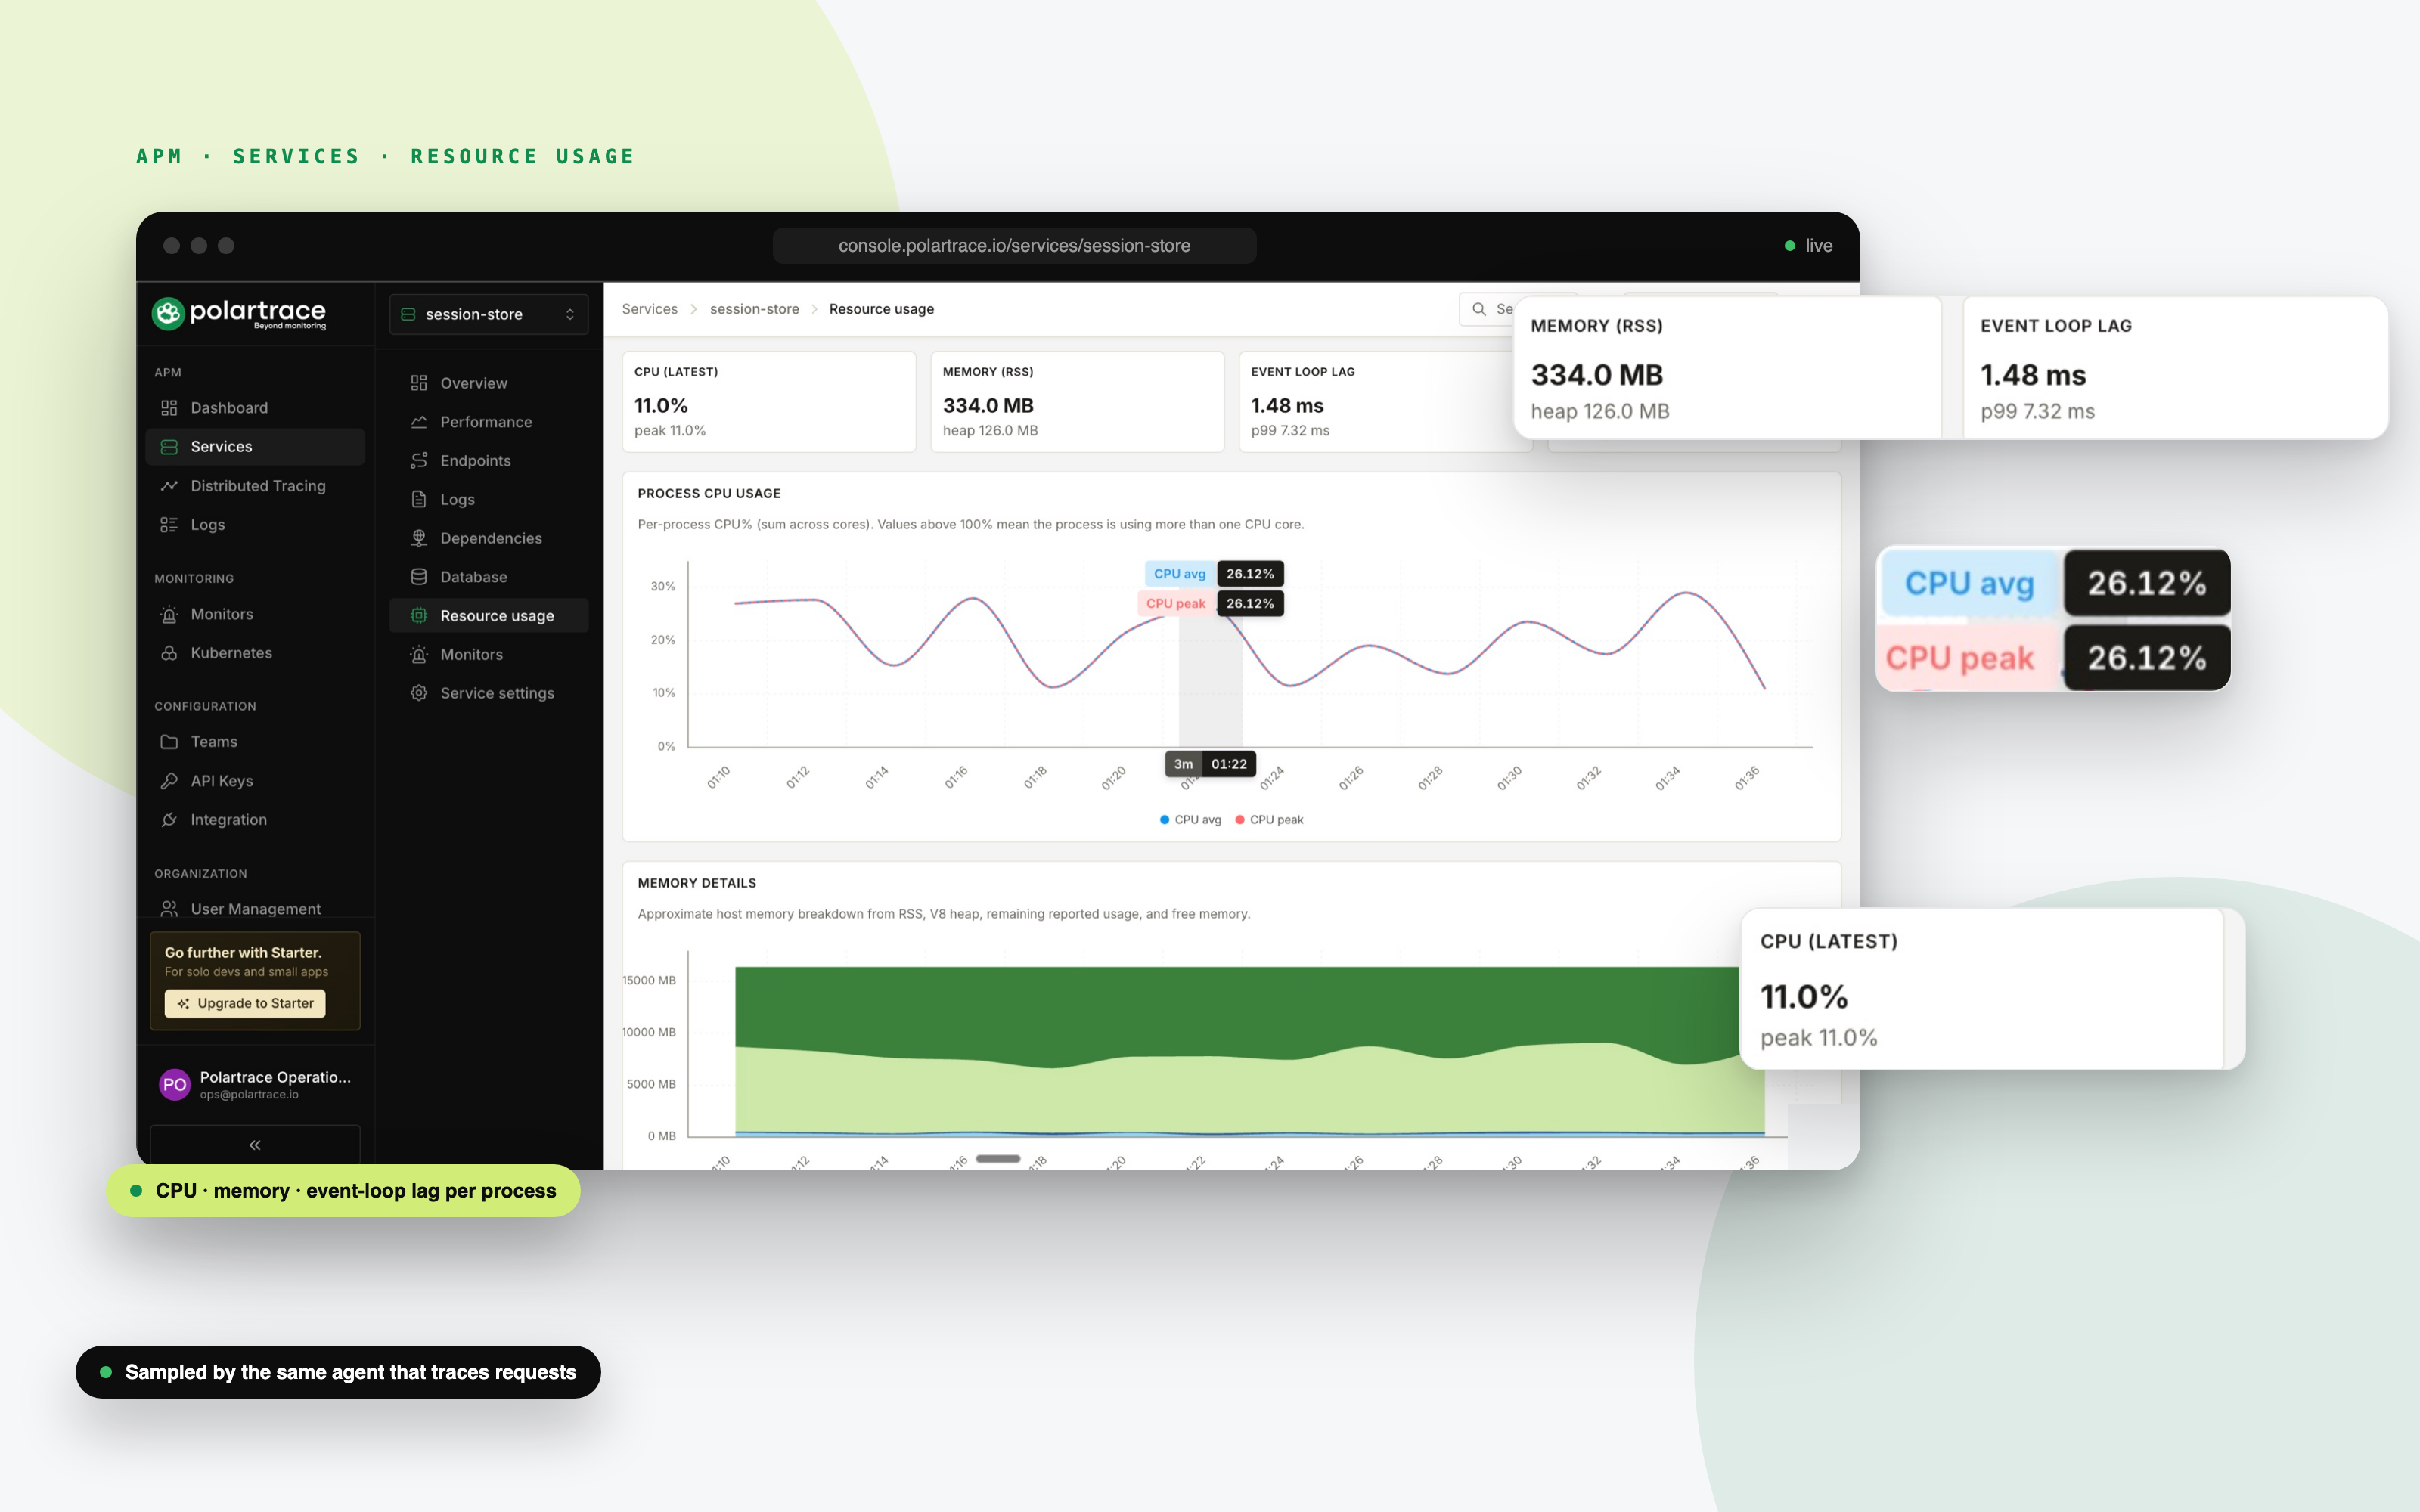
Requests, error rates, latency percentiles and active alerts for every service - with per-service drill-down into performance, endpoints, database operations and resource usage.
- Service list with p90/p99 latency, error rate and trends
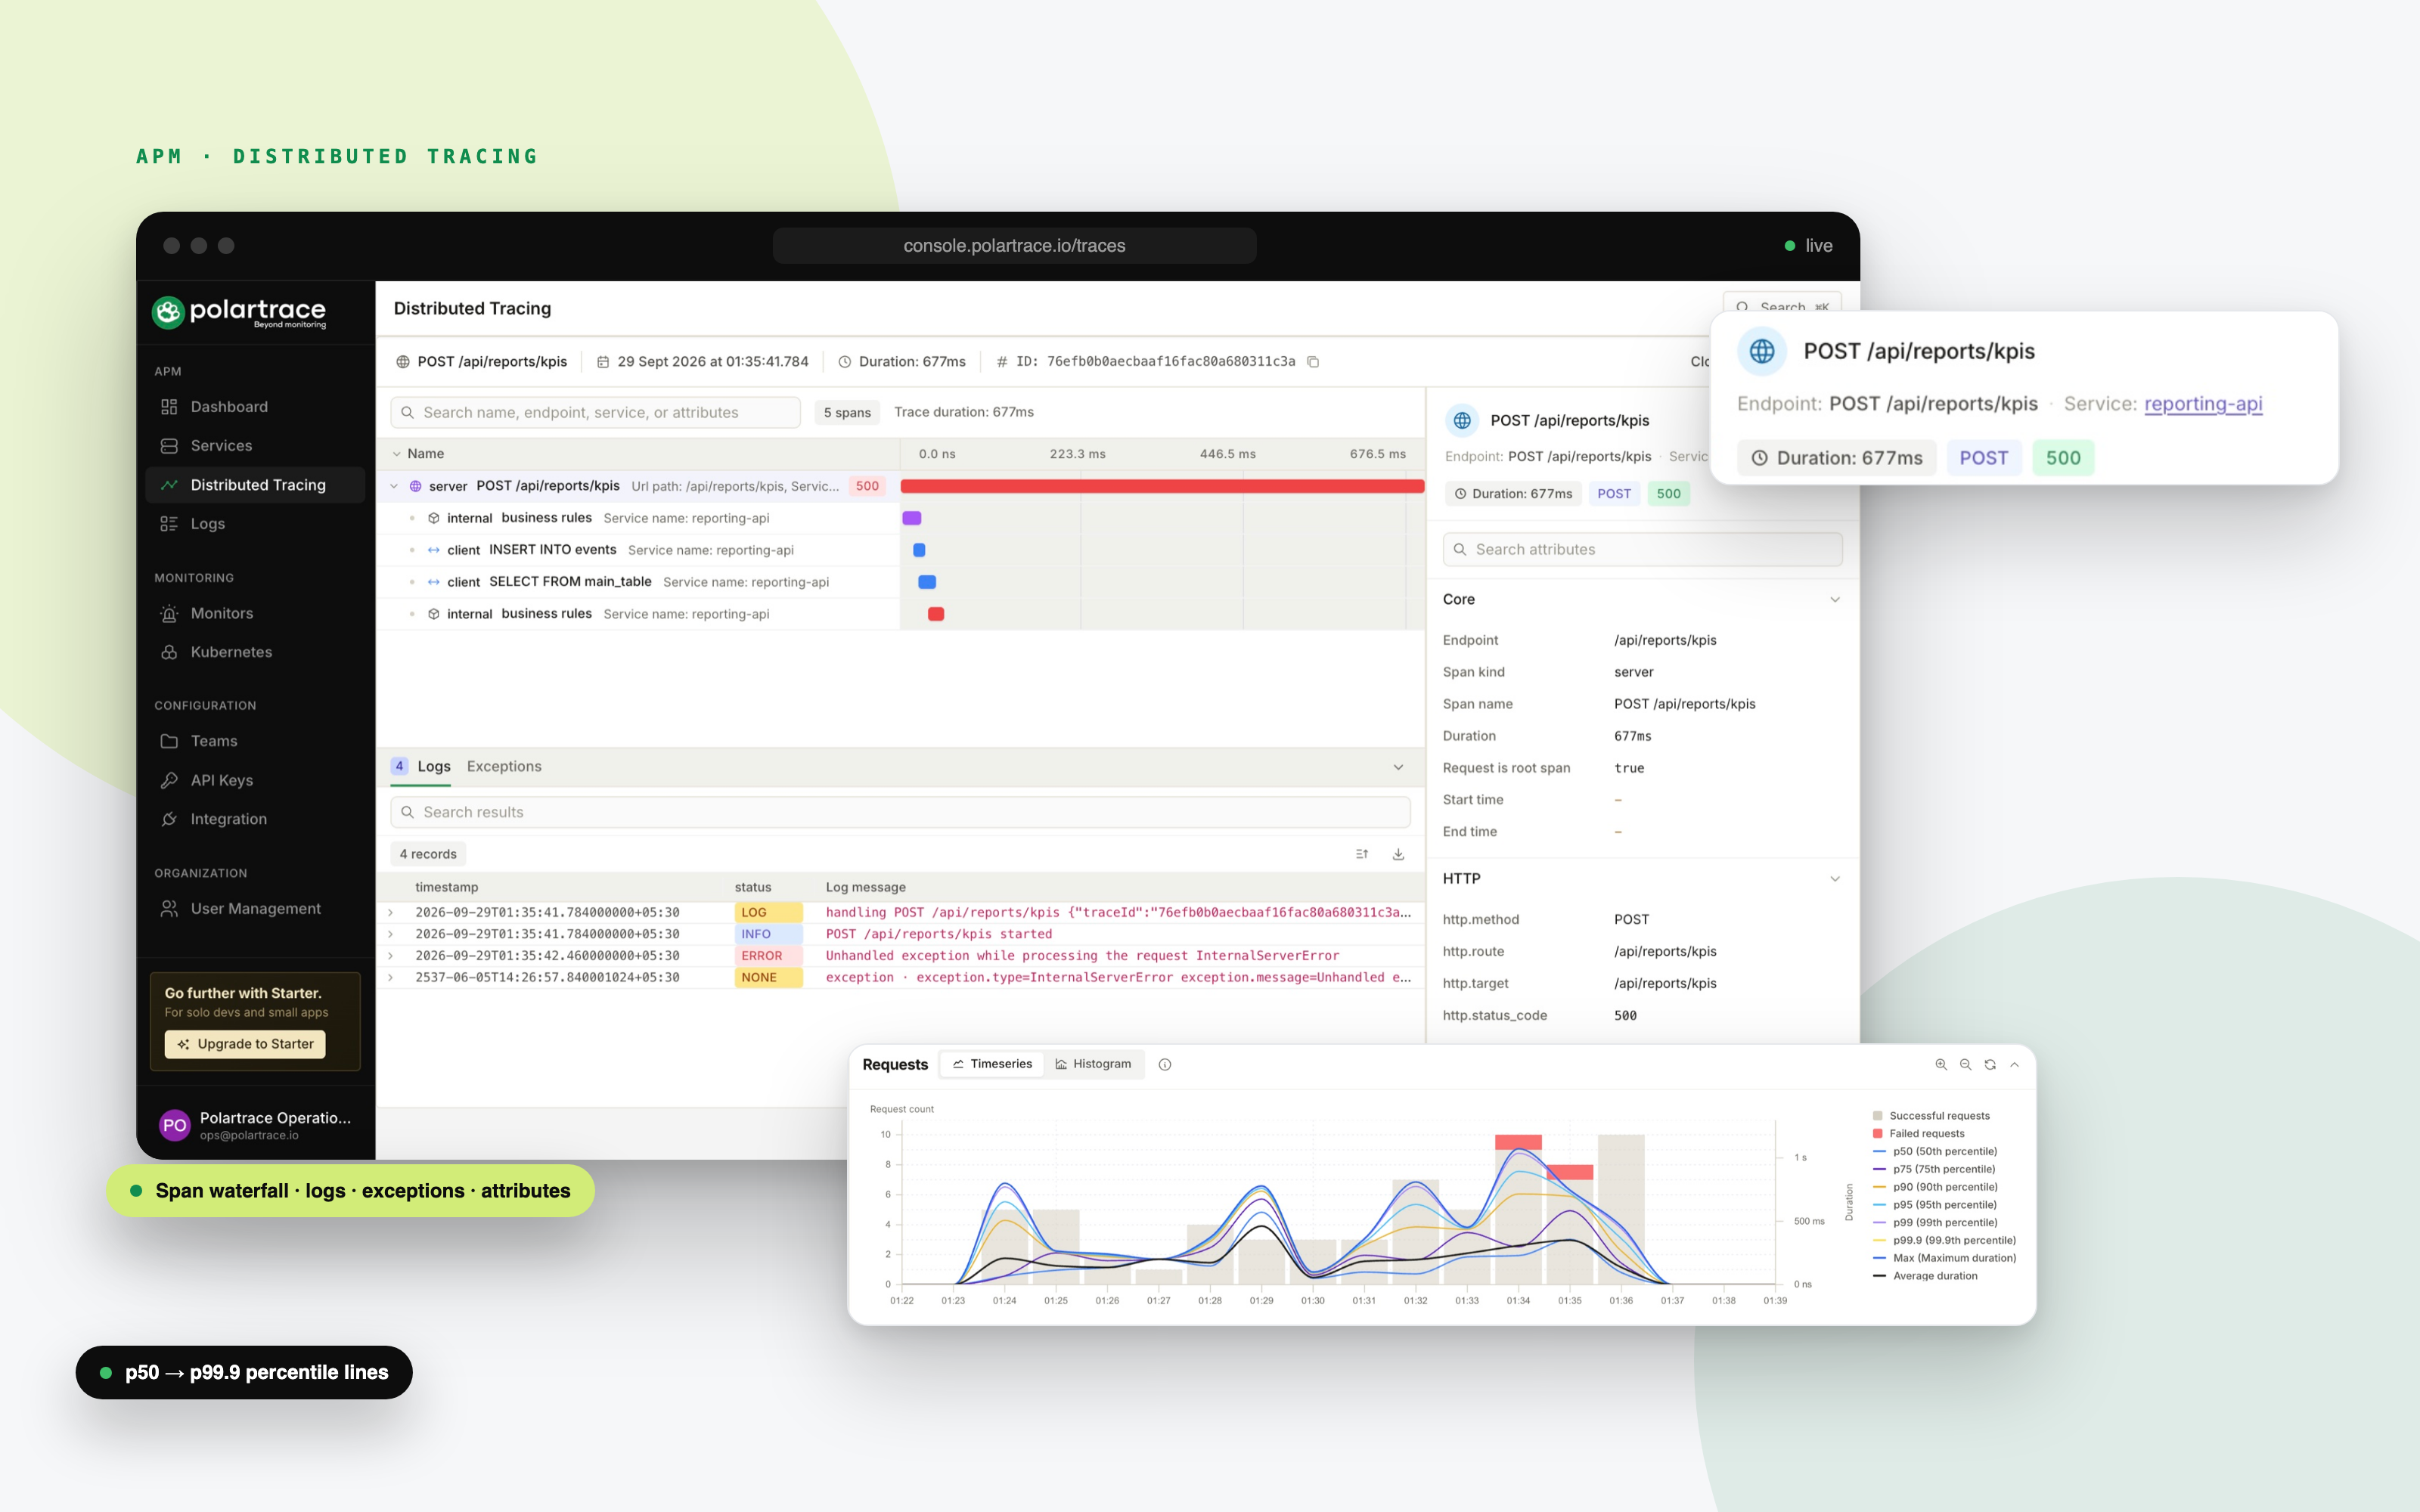
- Endpoint table ranked by total time, one click from its traces
- Top database operations and per-service dependency graph
- Process CPU, memory and event-loop lag per service