
















Observability beyond monitoring

Observability you can act on.

Distributed tracing, request logs, host metrics, Kubernetes and alerting for Node.js and Python teams - unified on OpenTelemetry, live in two commands, priced with two transparent meters.

Built on OpenTelemetryNo card requiredFree plan: 5 GB/mo, never billed

Trusted by engineering teams at

  • Aktivolabs
  • Speedoc
  • Qashier
  • HexaHealth
  • Fitterfly
  • Watch Your Health
  • Definedge
  • Baba
  • Secludy
  • Meru Health
  • Wafeq
  • Pluto
  • RemotePass
  • Shipfinex
  • IXI
  • CurifyLabs
  • Enfuce
  • SymPhysis Medical
  • Evervault

Platform

What do you need to see?

Six product surfaces, one signal graph - every one included on every plan, Free included.

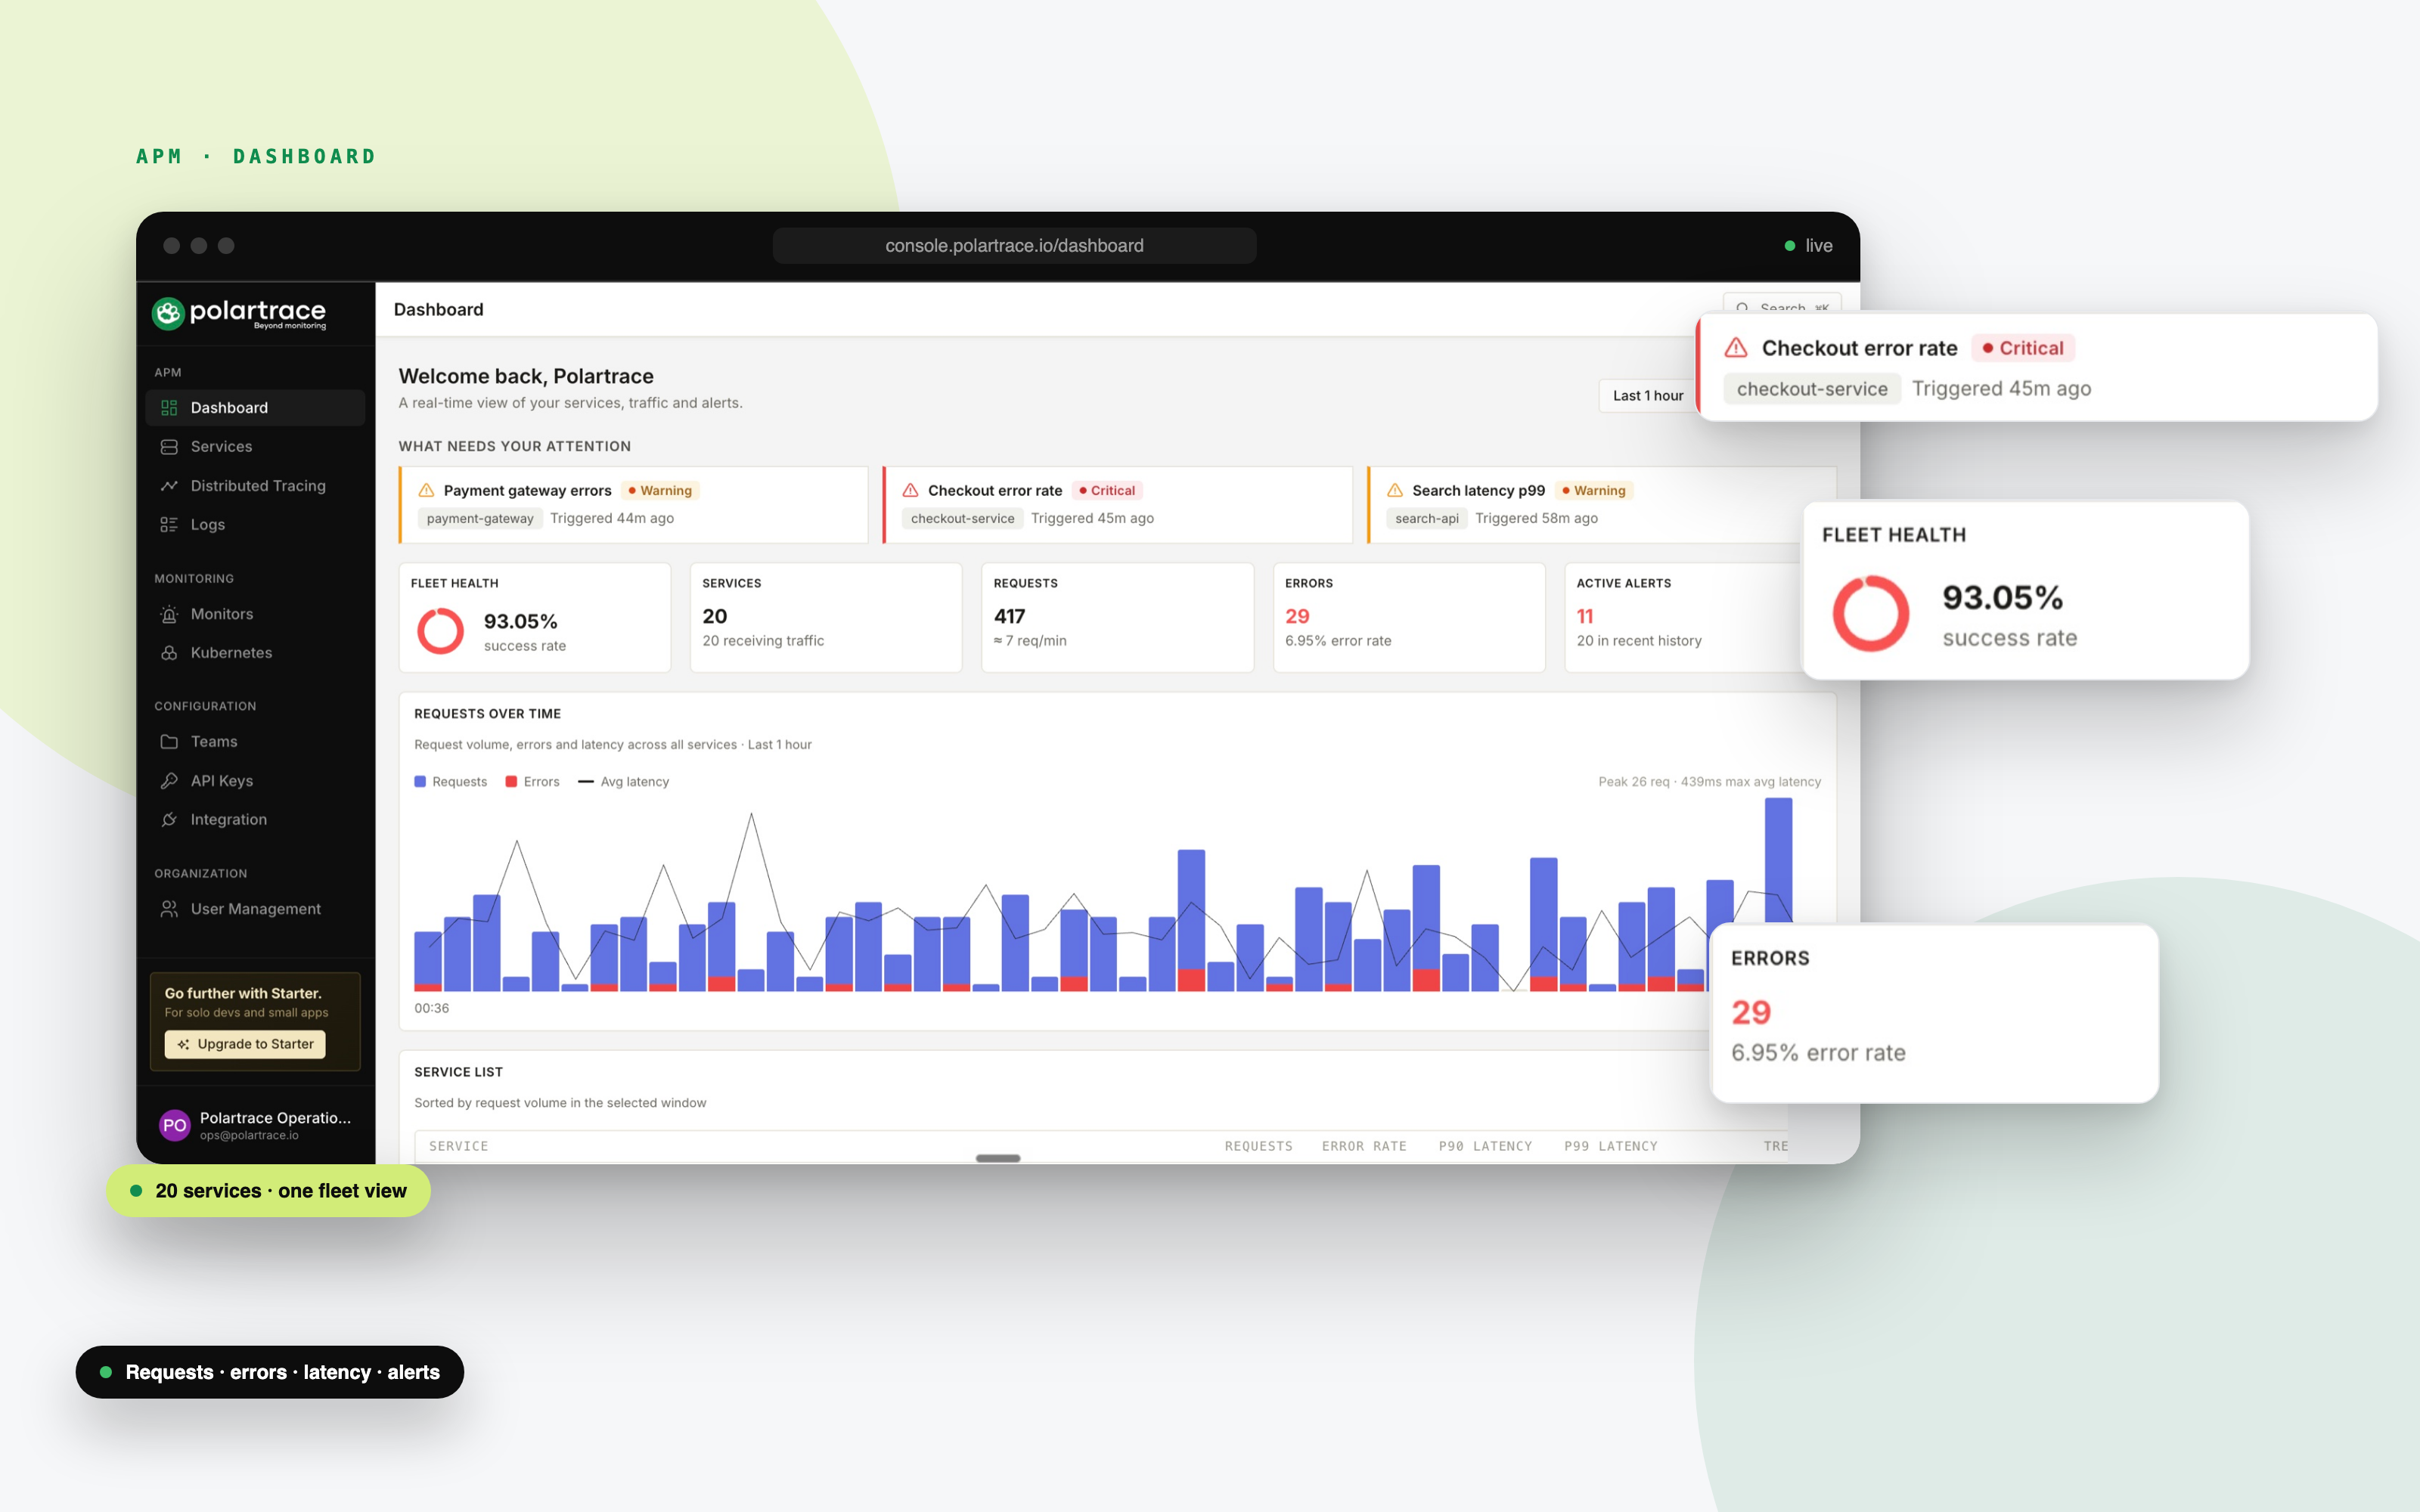
Polartrace dashboard: attention cards for payment gateway, checkout and search alerts, fleet health, requests and errors

APM & Services

The whole fleet on one dashboard.

Requests, error rates, latency percentiles and active alerts for every service - with per-service drill-down into performance, endpoints, database operations and resource usage.

  • Service list with p90/p99 latency, error rate and trends
  • Endpoint table ranked by total time, one click from its traces
  • Top database operations and per-service dependency graph
Learn more
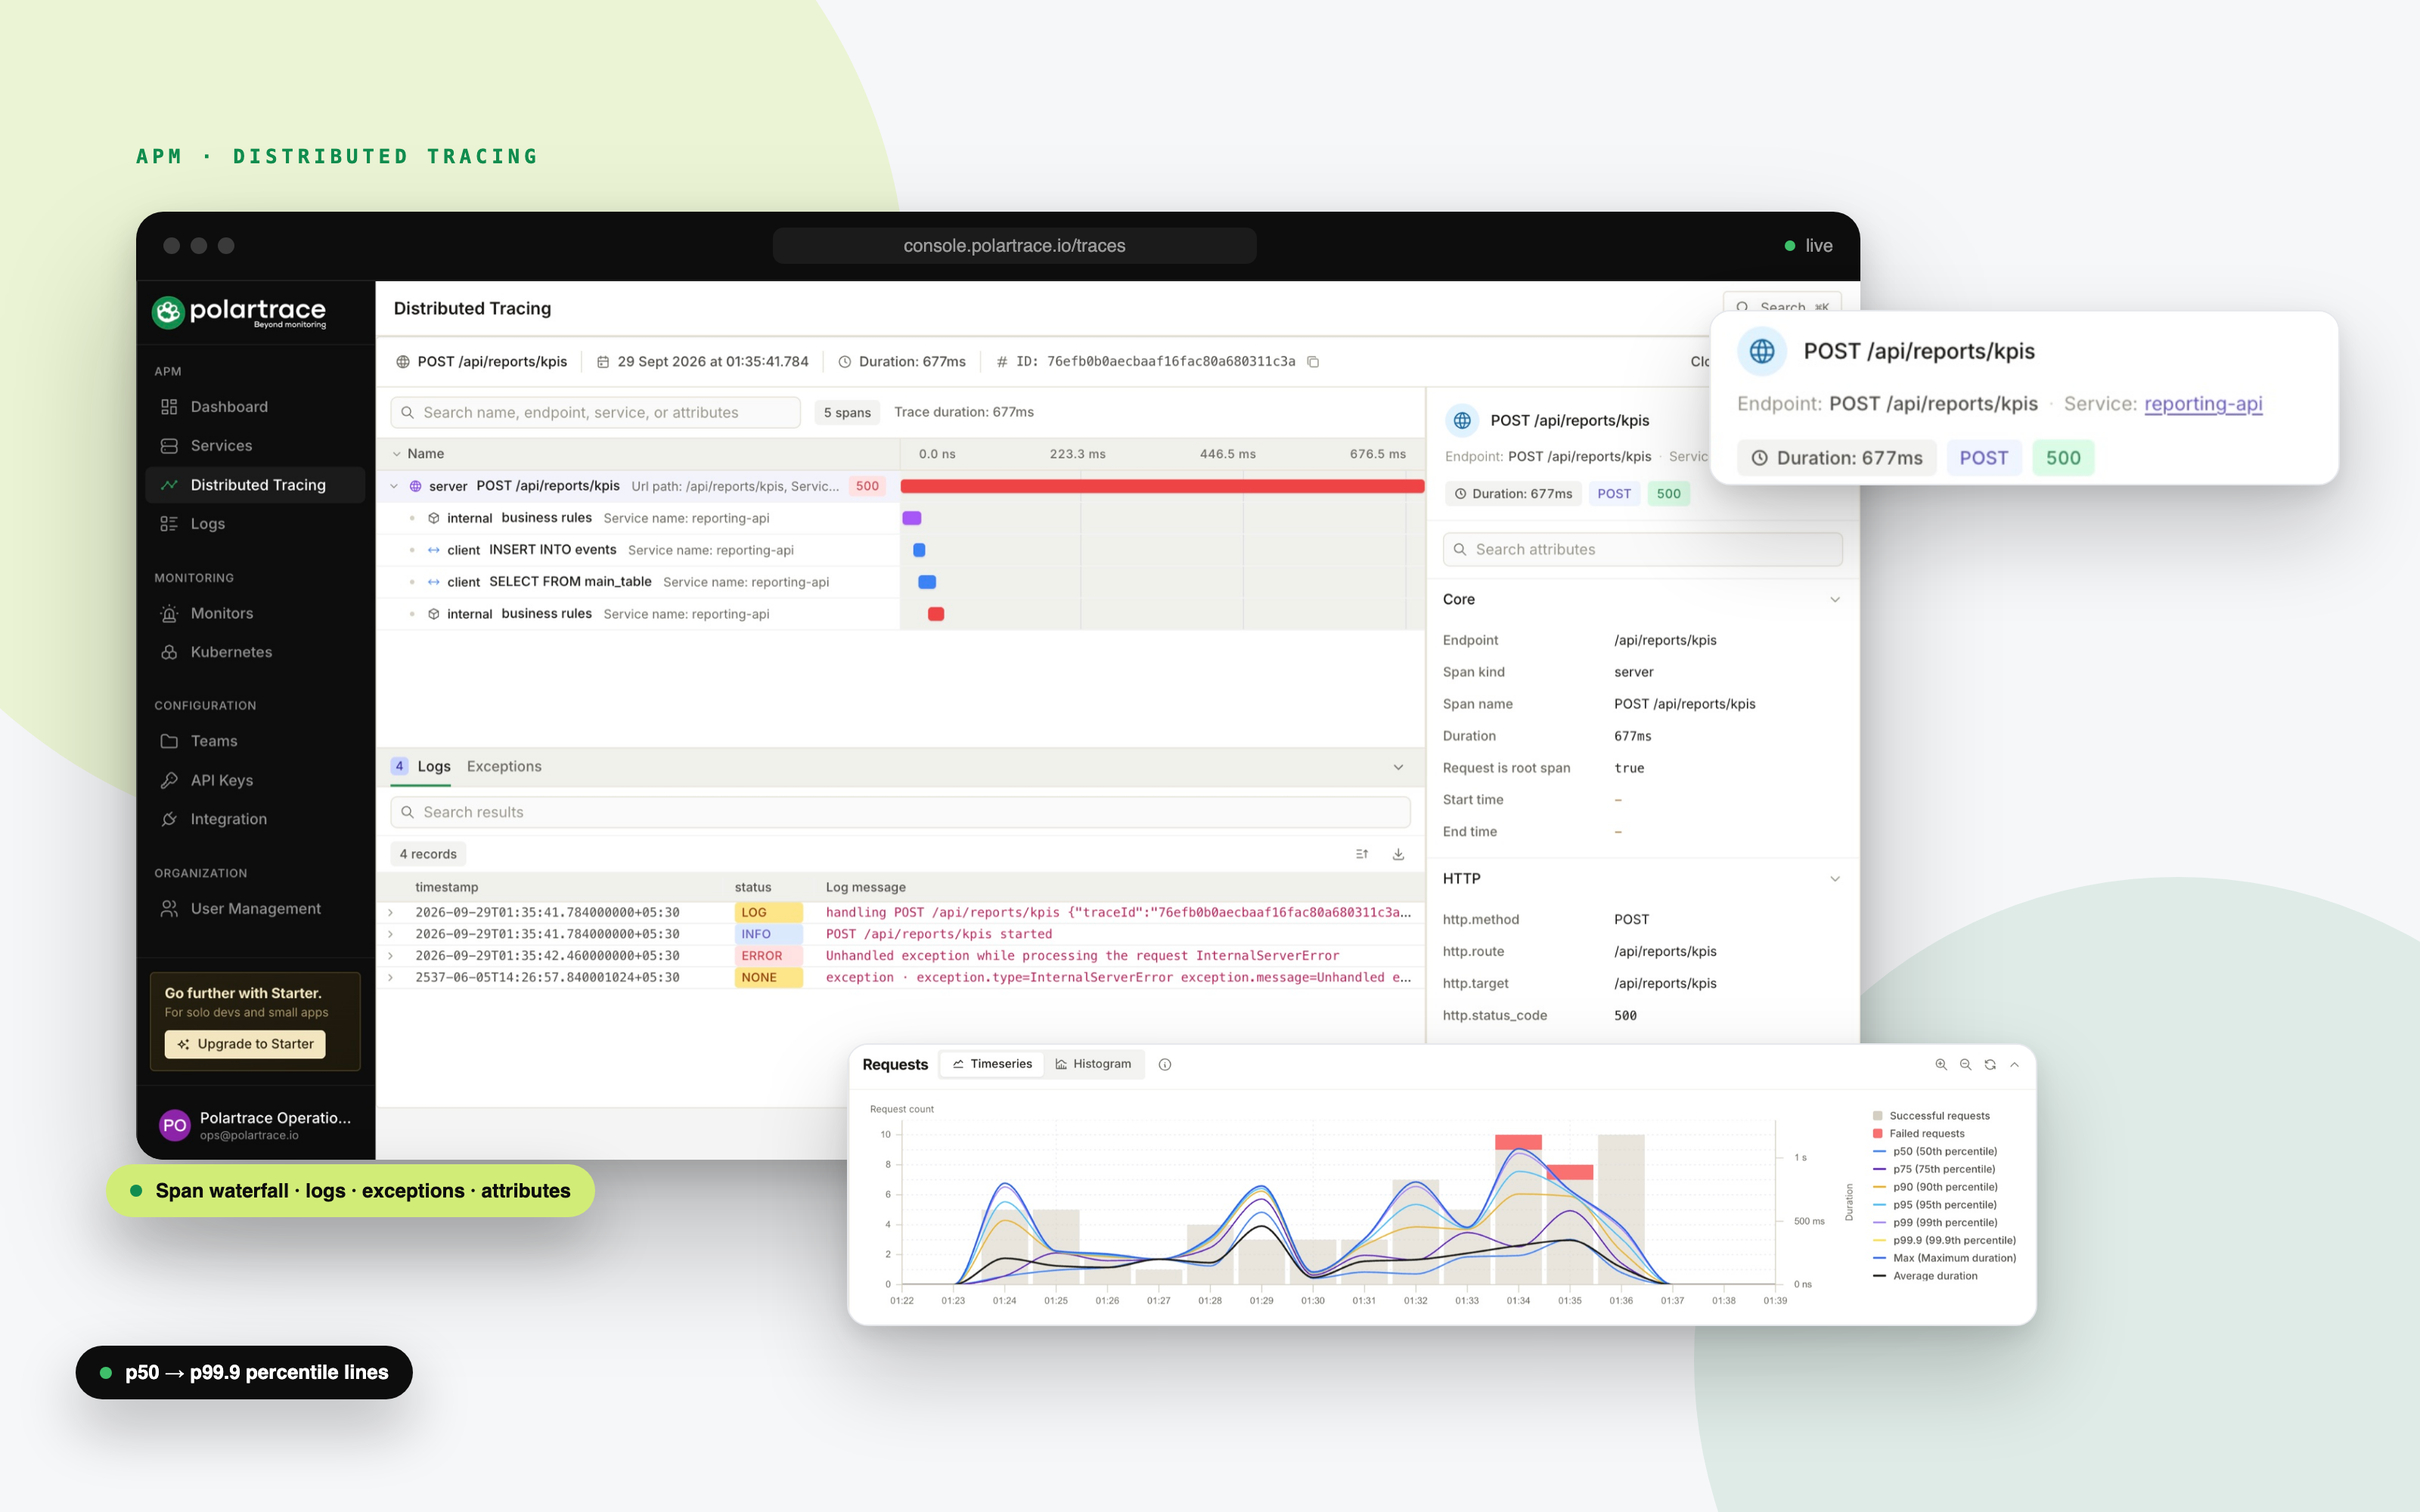
Polartrace trace view for POST /api/reports/kpis: span waterfall, correlated logs and span attributes

Distributed Tracing

One request, every hop, all the timings.

OpenTelemetry-powered spans with automatic context propagation. HTTP calls, MongoDB and PostgreSQL queries, Redis commands - laid out on a waterfall you can read at 2 a.m.

  • Span waterfall with kind, status, attributes, events and links
  • Latency percentile lines: p50, p75, p90, p95, p99, p99.9, max
  • Log-scale duration histogram with percentile markers
Learn more
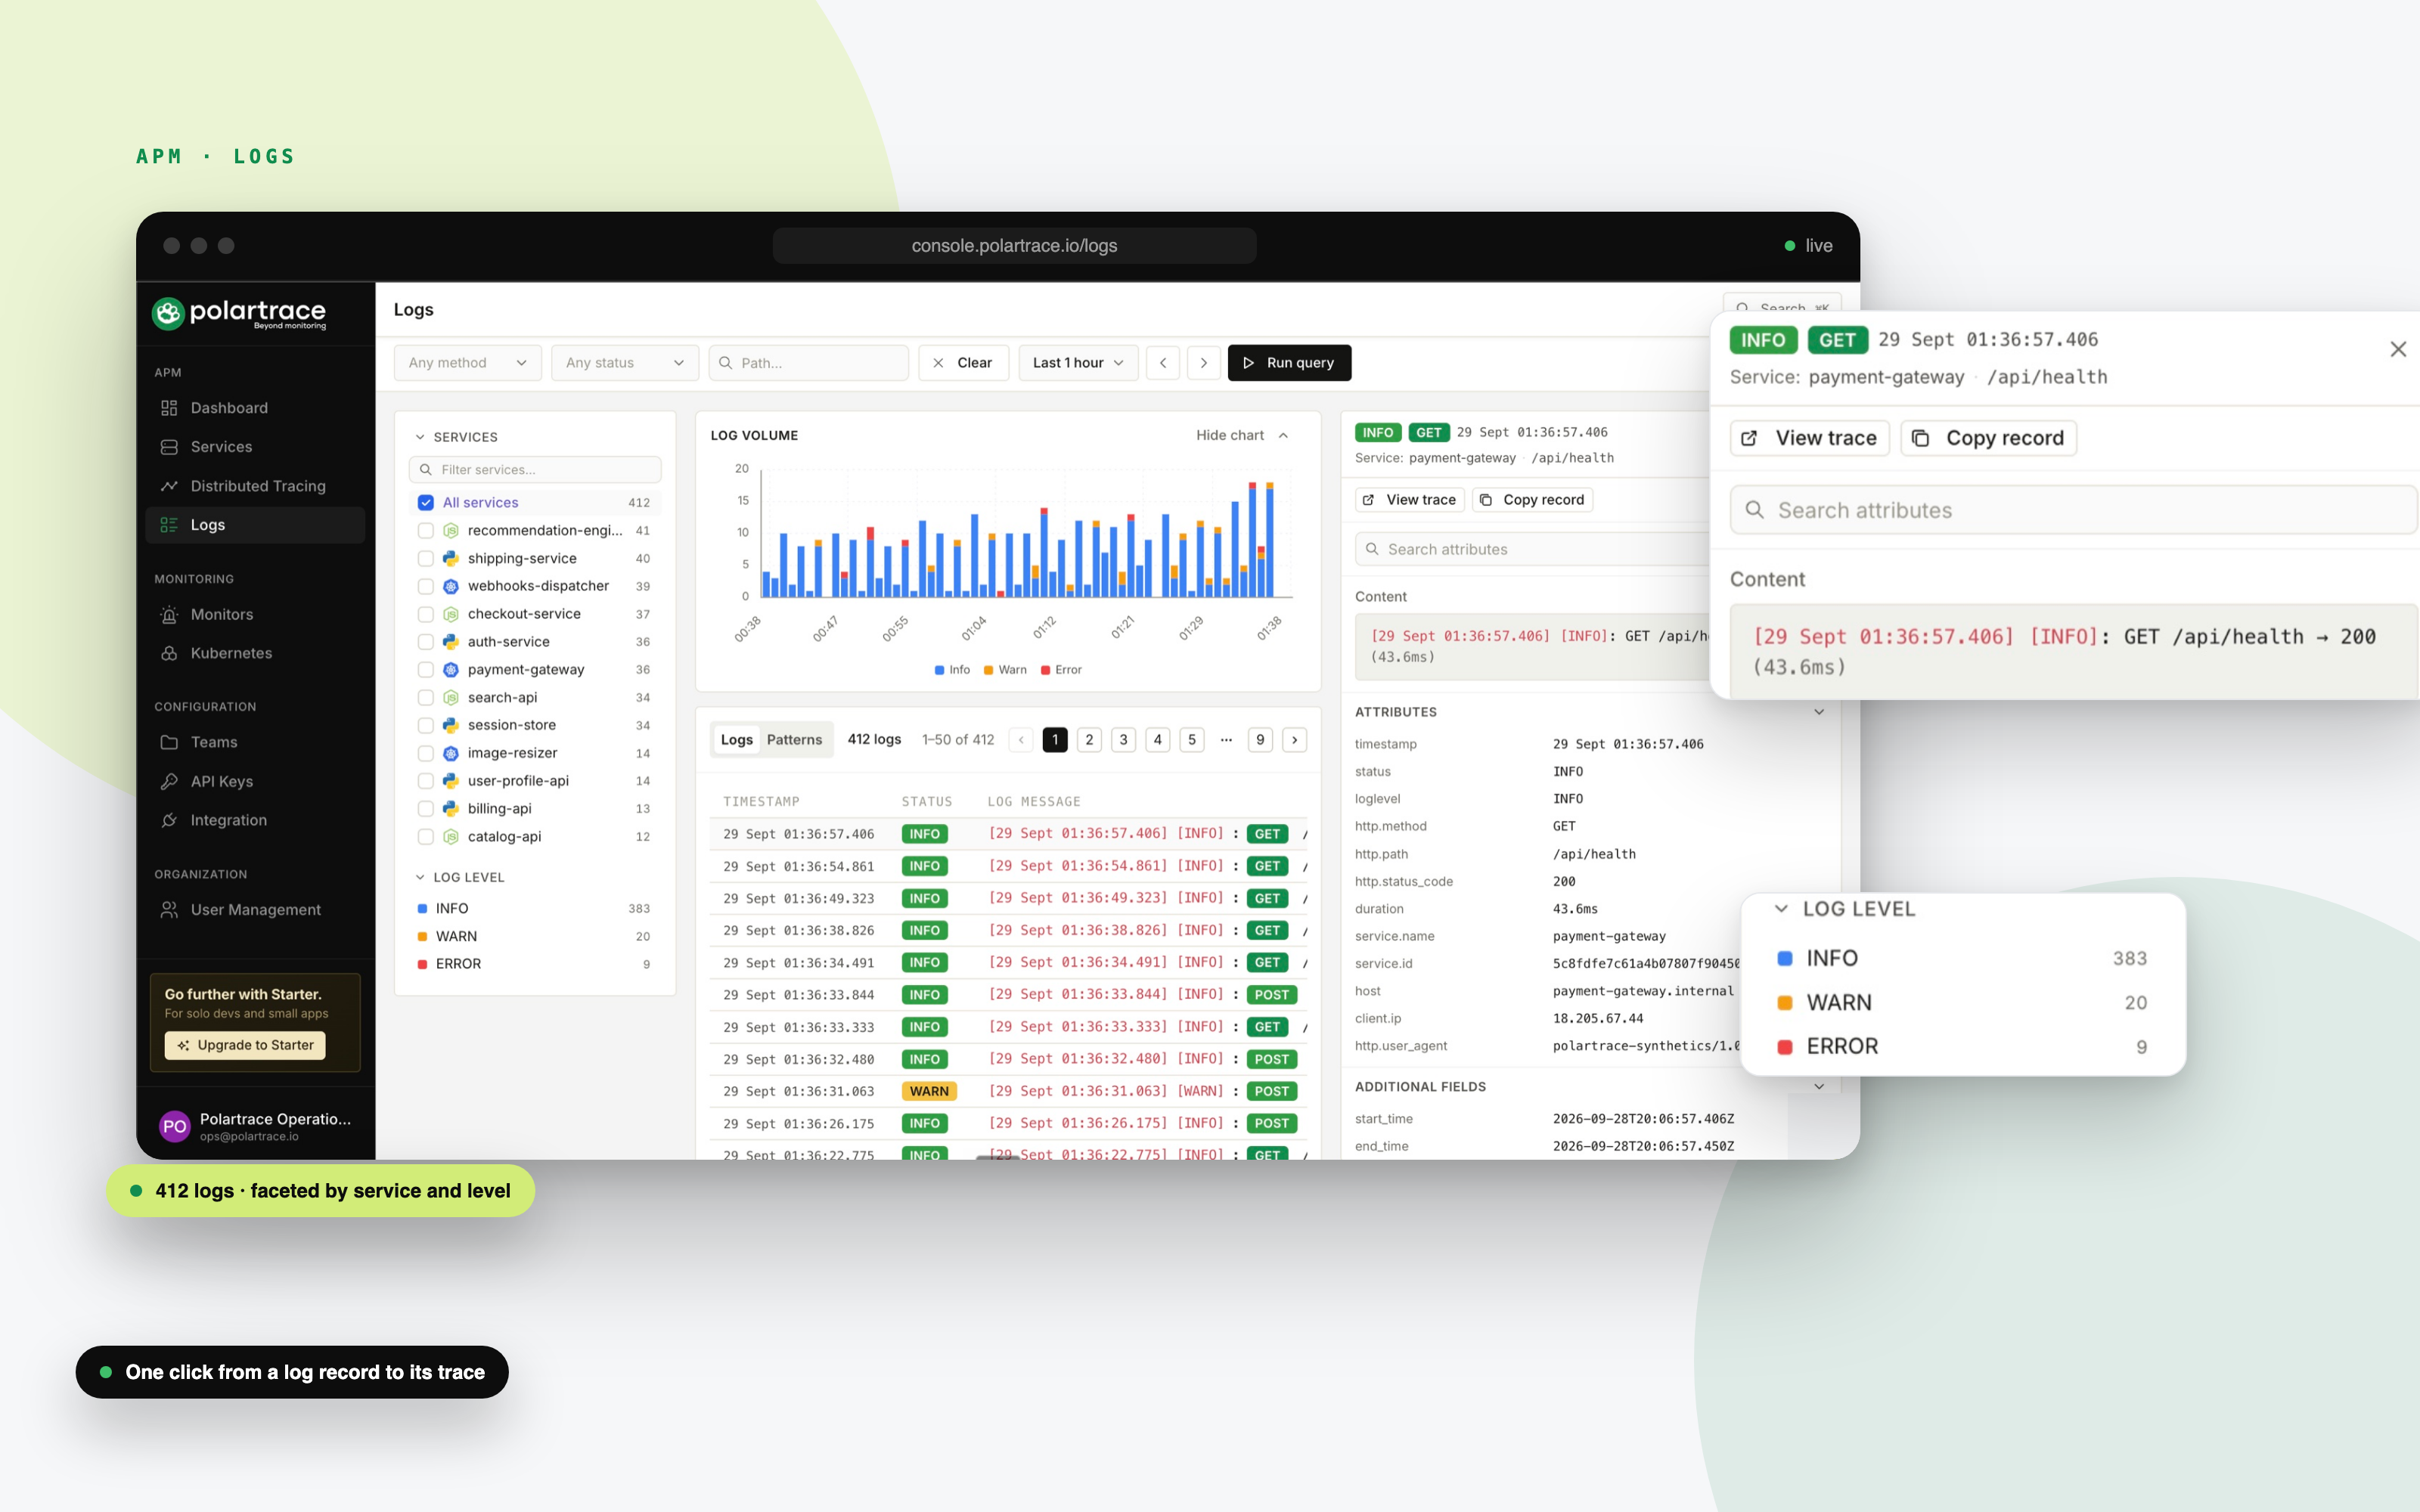
Polartrace logs explorer: services and log level facets, log volume chart and log rows

Log Management

Request logs that carry their own context.

Every request arrives with method, path, status, duration, headers and - for Node.js - captured console output, error stacks and the trace ID that joins it to its distributed trace.

  • Faceted explorer: filter by service, level, status class, path and time
  • Endpoint patterns with error counts and sparklines
  • Live tail that updates every few seconds
Learn more
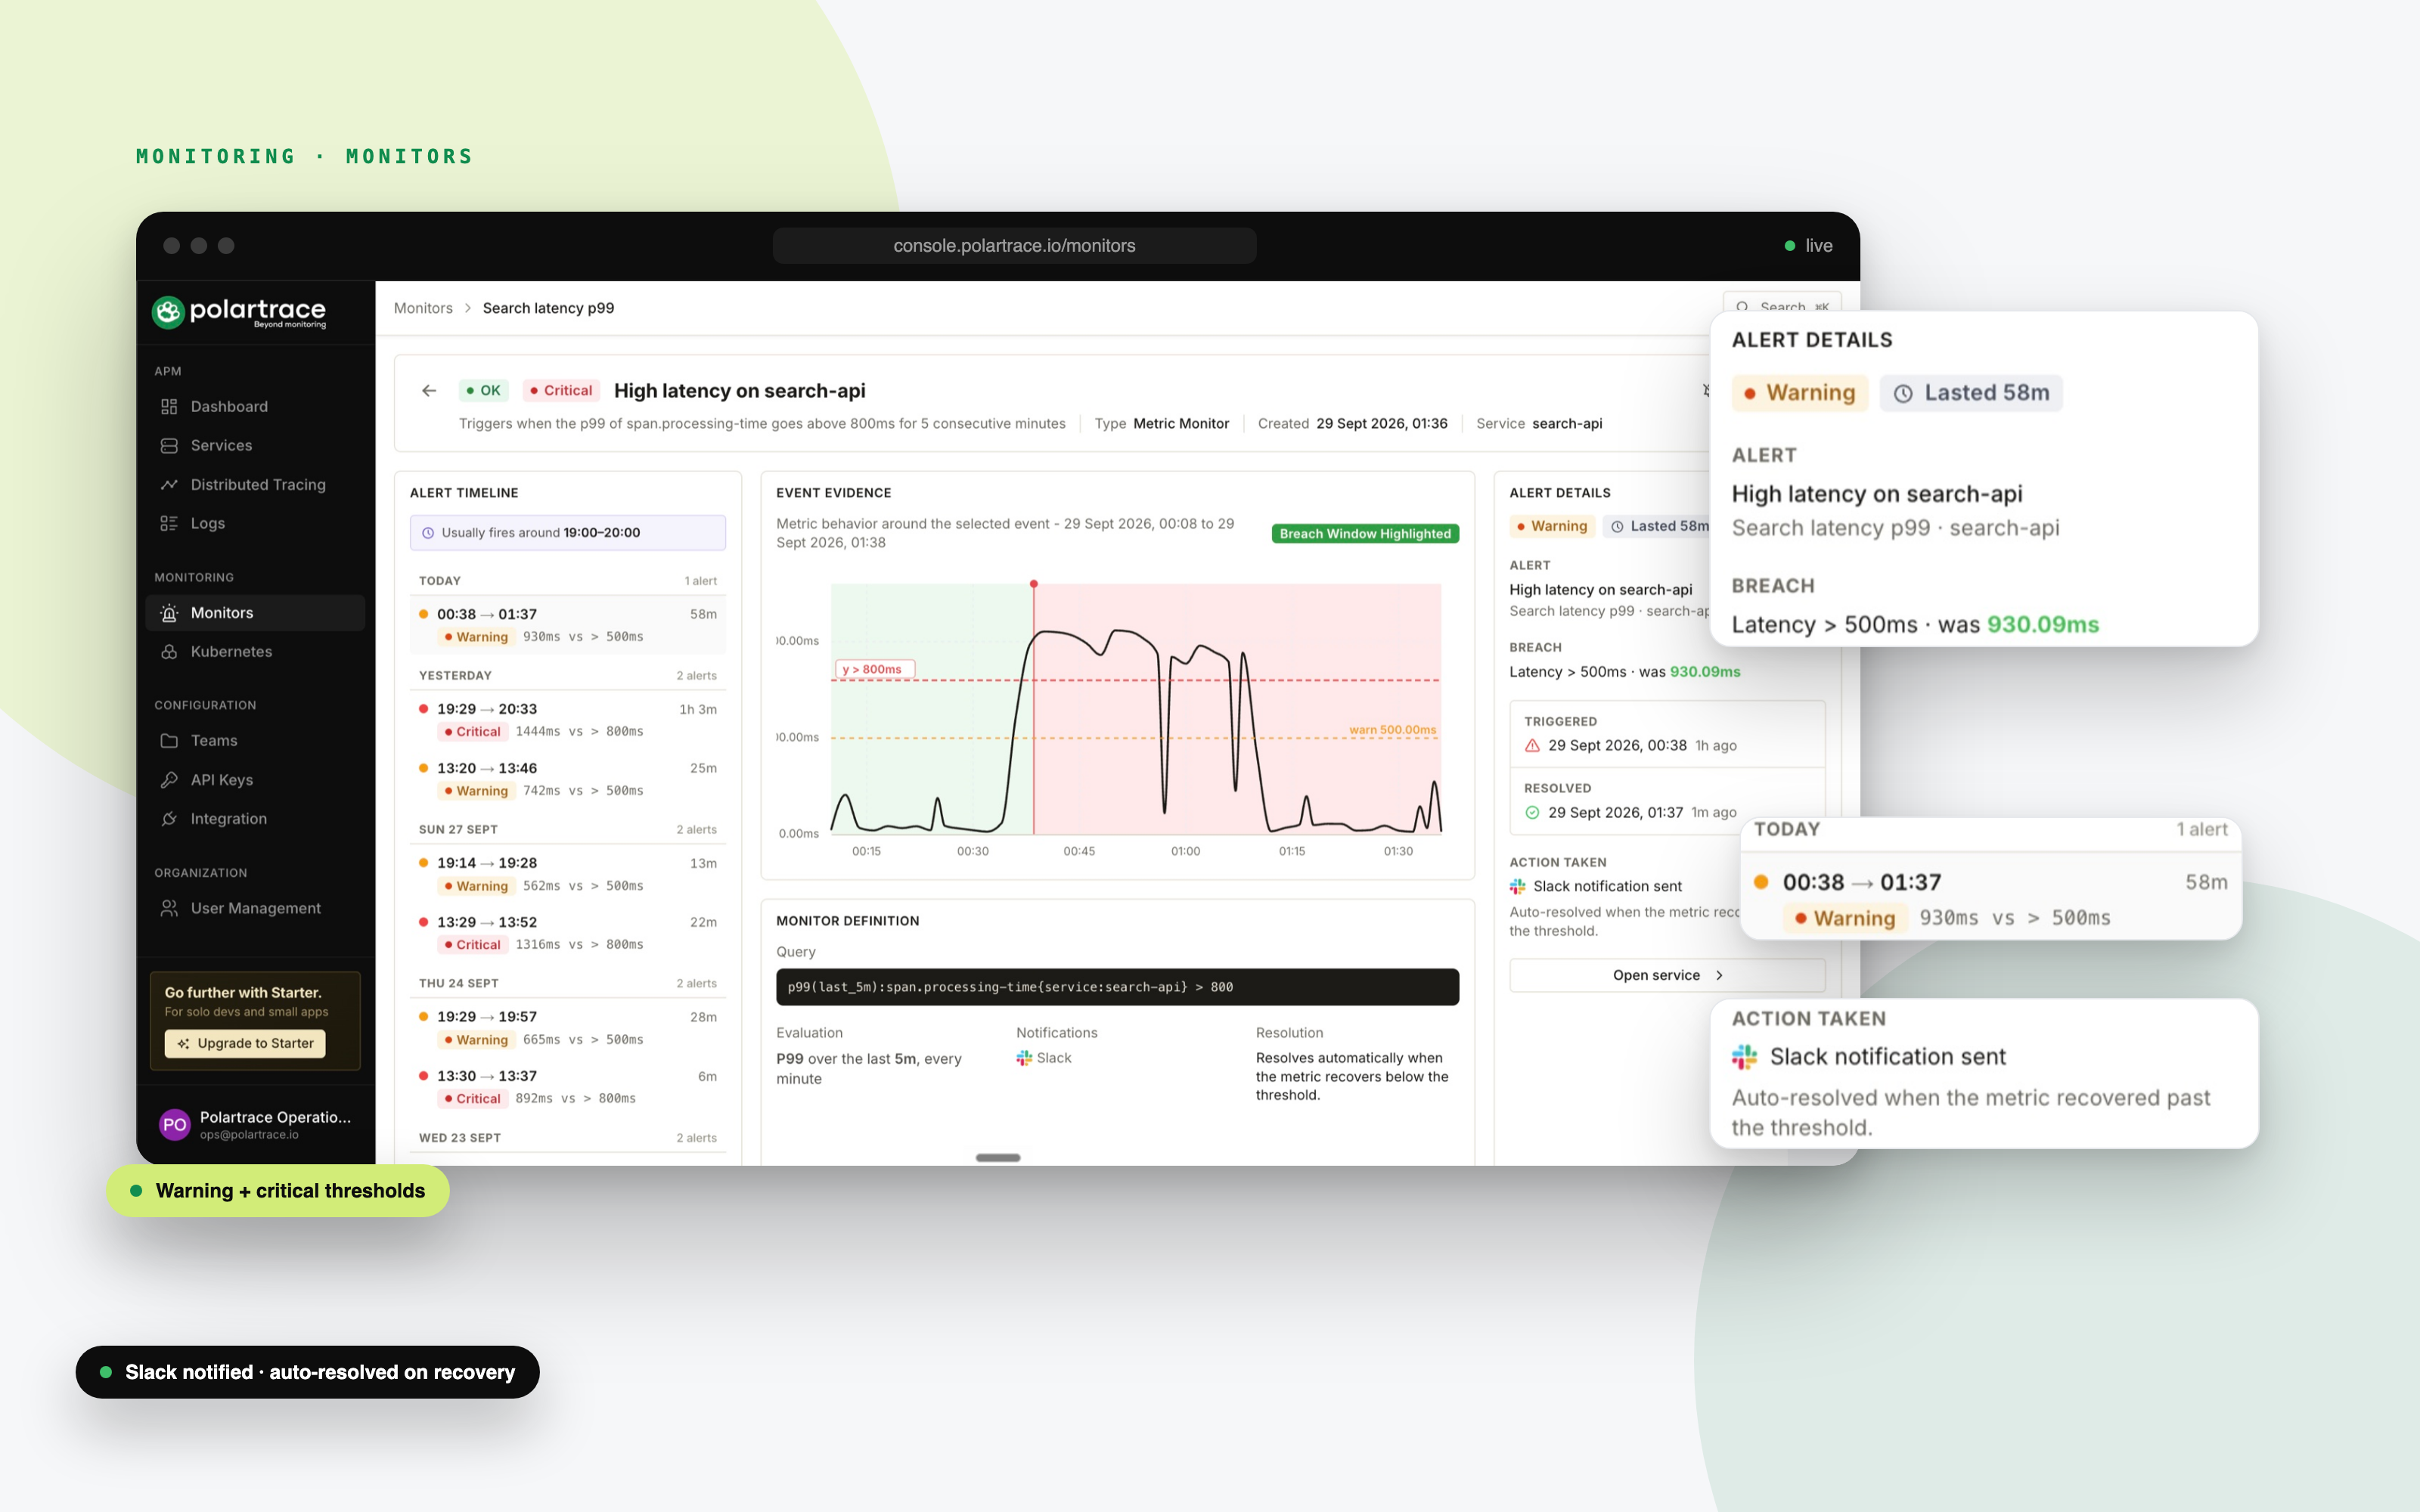
Polartrace monitor detail for high latency on search-api: alert timeline, evidence chart and Slack notification

Monitors & Alerts

Thresholds with a warning shot.

Monitors evaluate every minute across error rate, p99 latency, CPU, memory, request volume and Kubernetes health - with separate warning and critical thresholds, and alerts that tell you when things recover, too.

  • 8 monitor metrics including Kubernetes pod & node health
  • Dual warning + critical thresholds with live preview
  • Slack and email delivery with a trend chart and deep link
Learn more
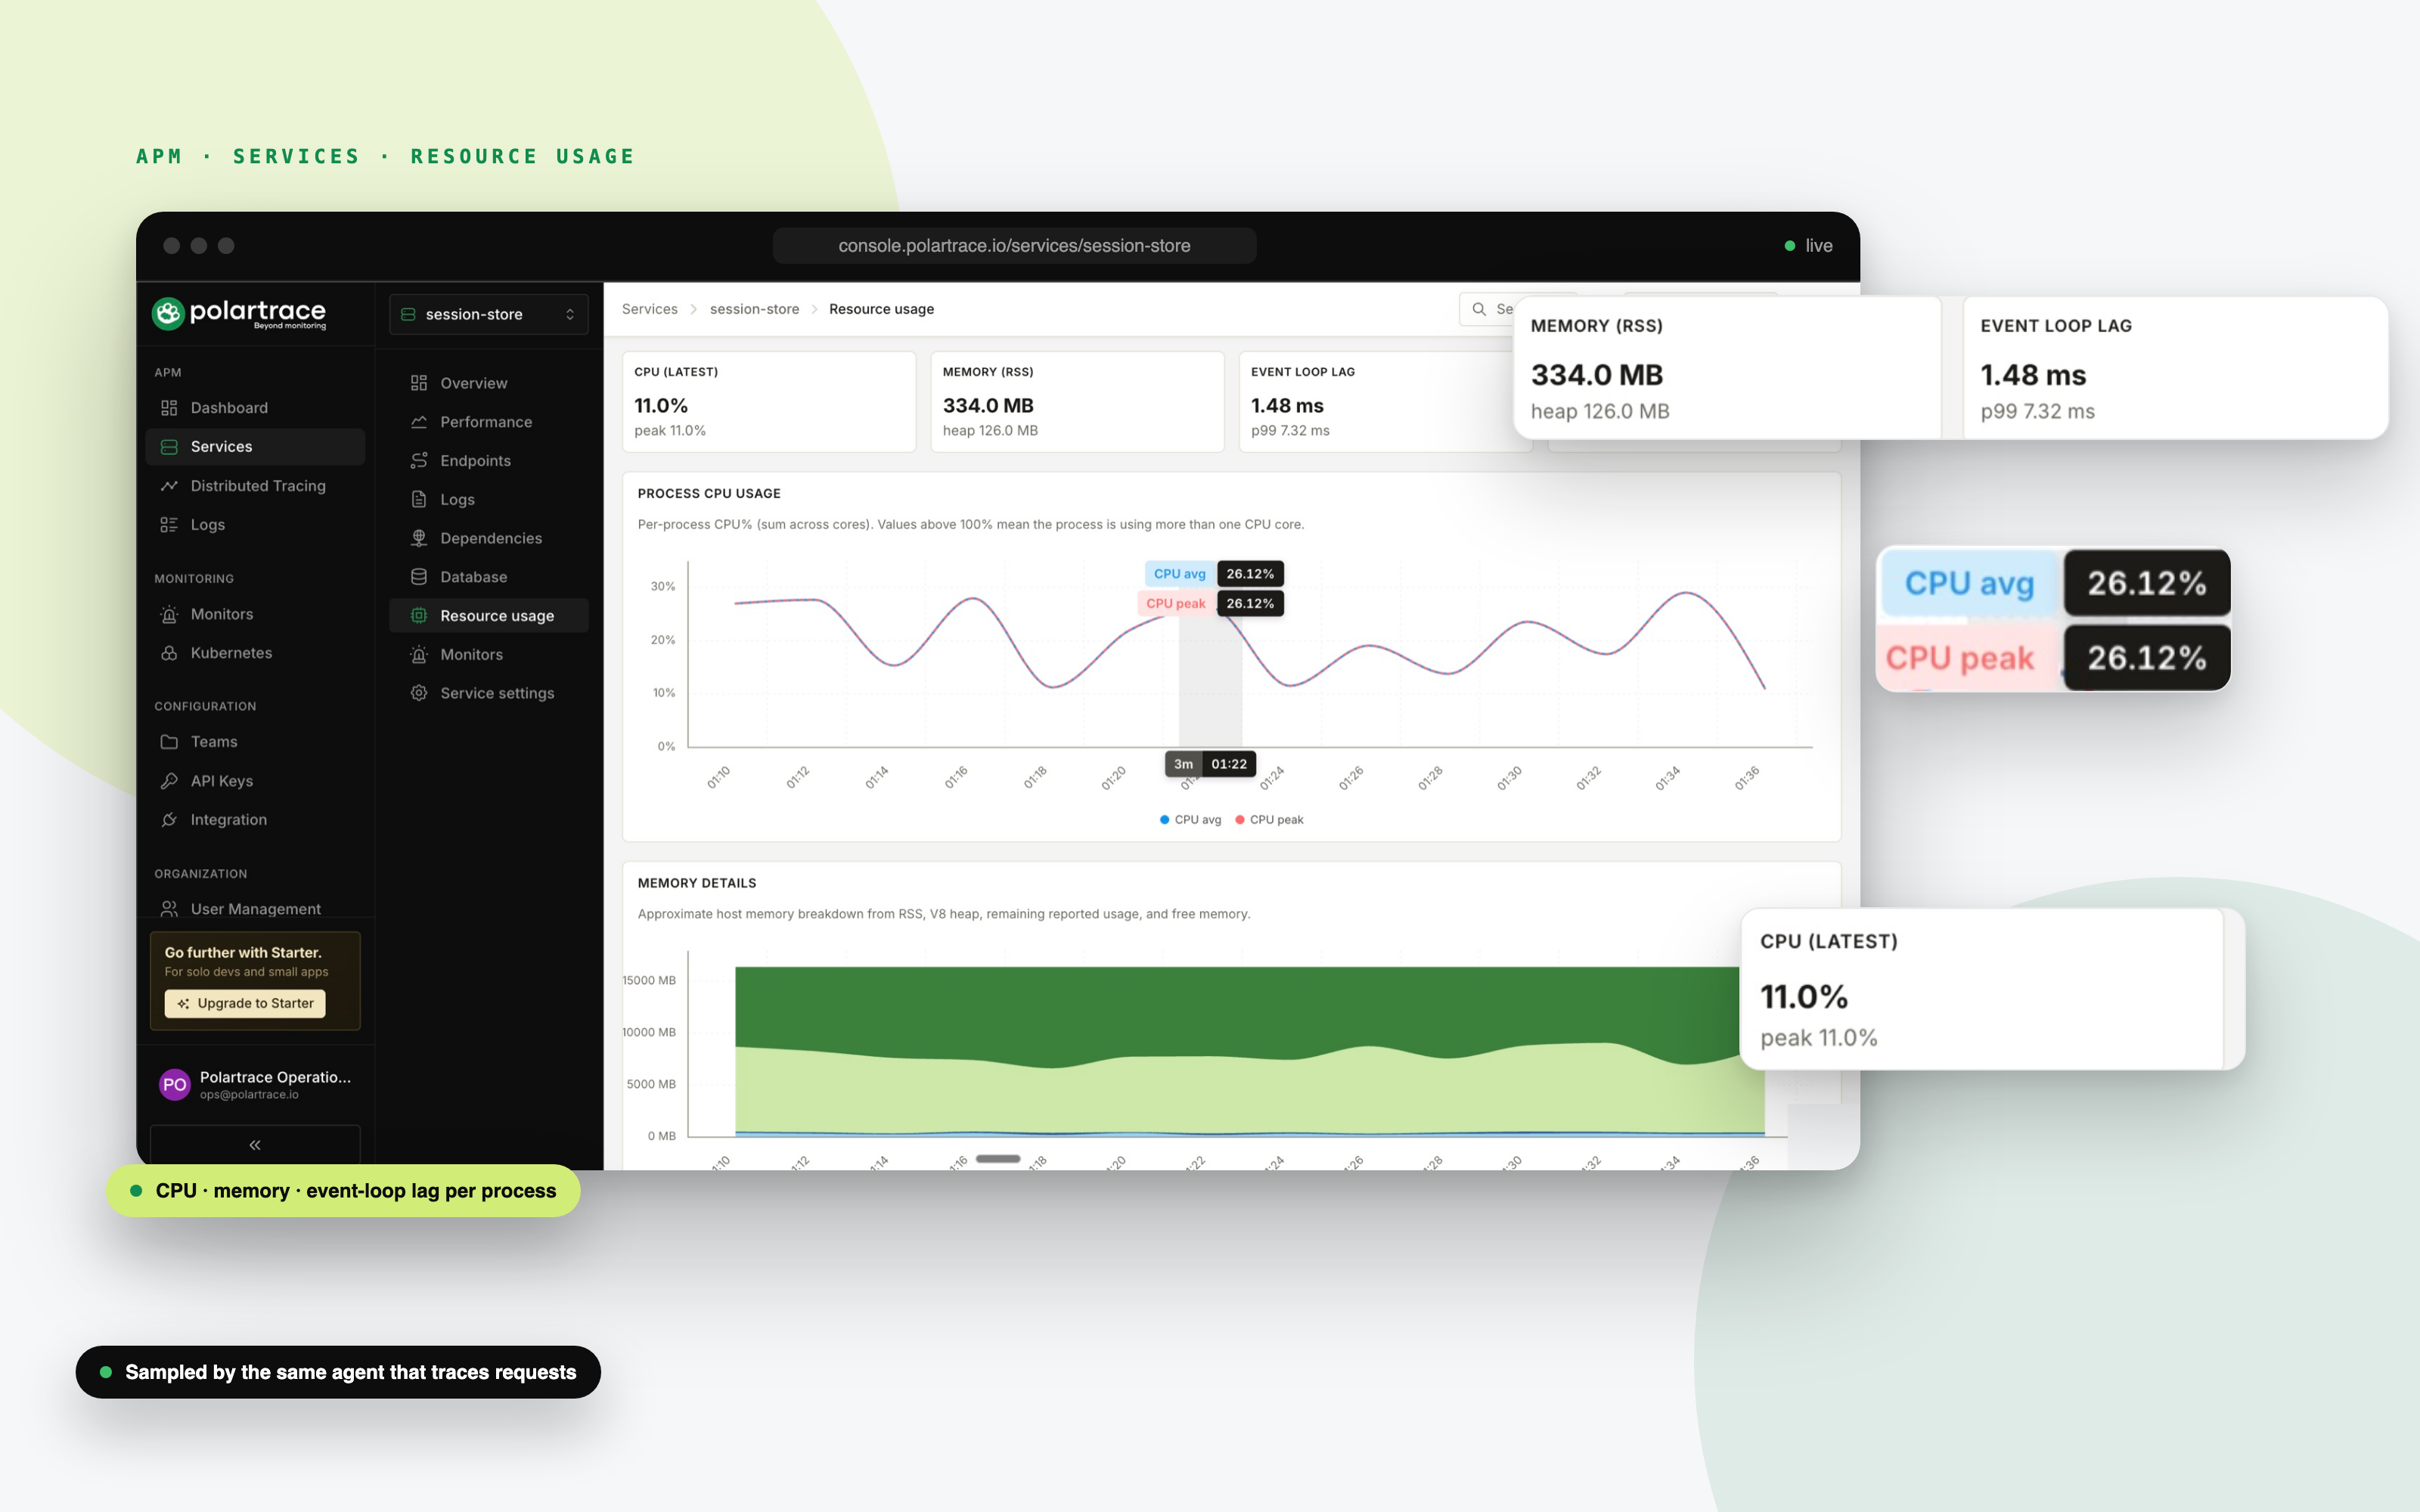
Polartrace resource usage for session-store: CPU, memory RSS, event loop lag and instance cards

Runtime & Host Metrics

The metrics that explain your latency.

Percentiles tell you something is slow; runtime metrics tell you why. Process CPU, memory RSS, host load and Node.js event-loop lag are sampled continuously by the same agent that traces your requests.

  • p50–p99.9 latency per service and per endpoint
  • Process CPU, memory and host load averages
  • Event-loop delay mean and p99 for Node.js
Learn more
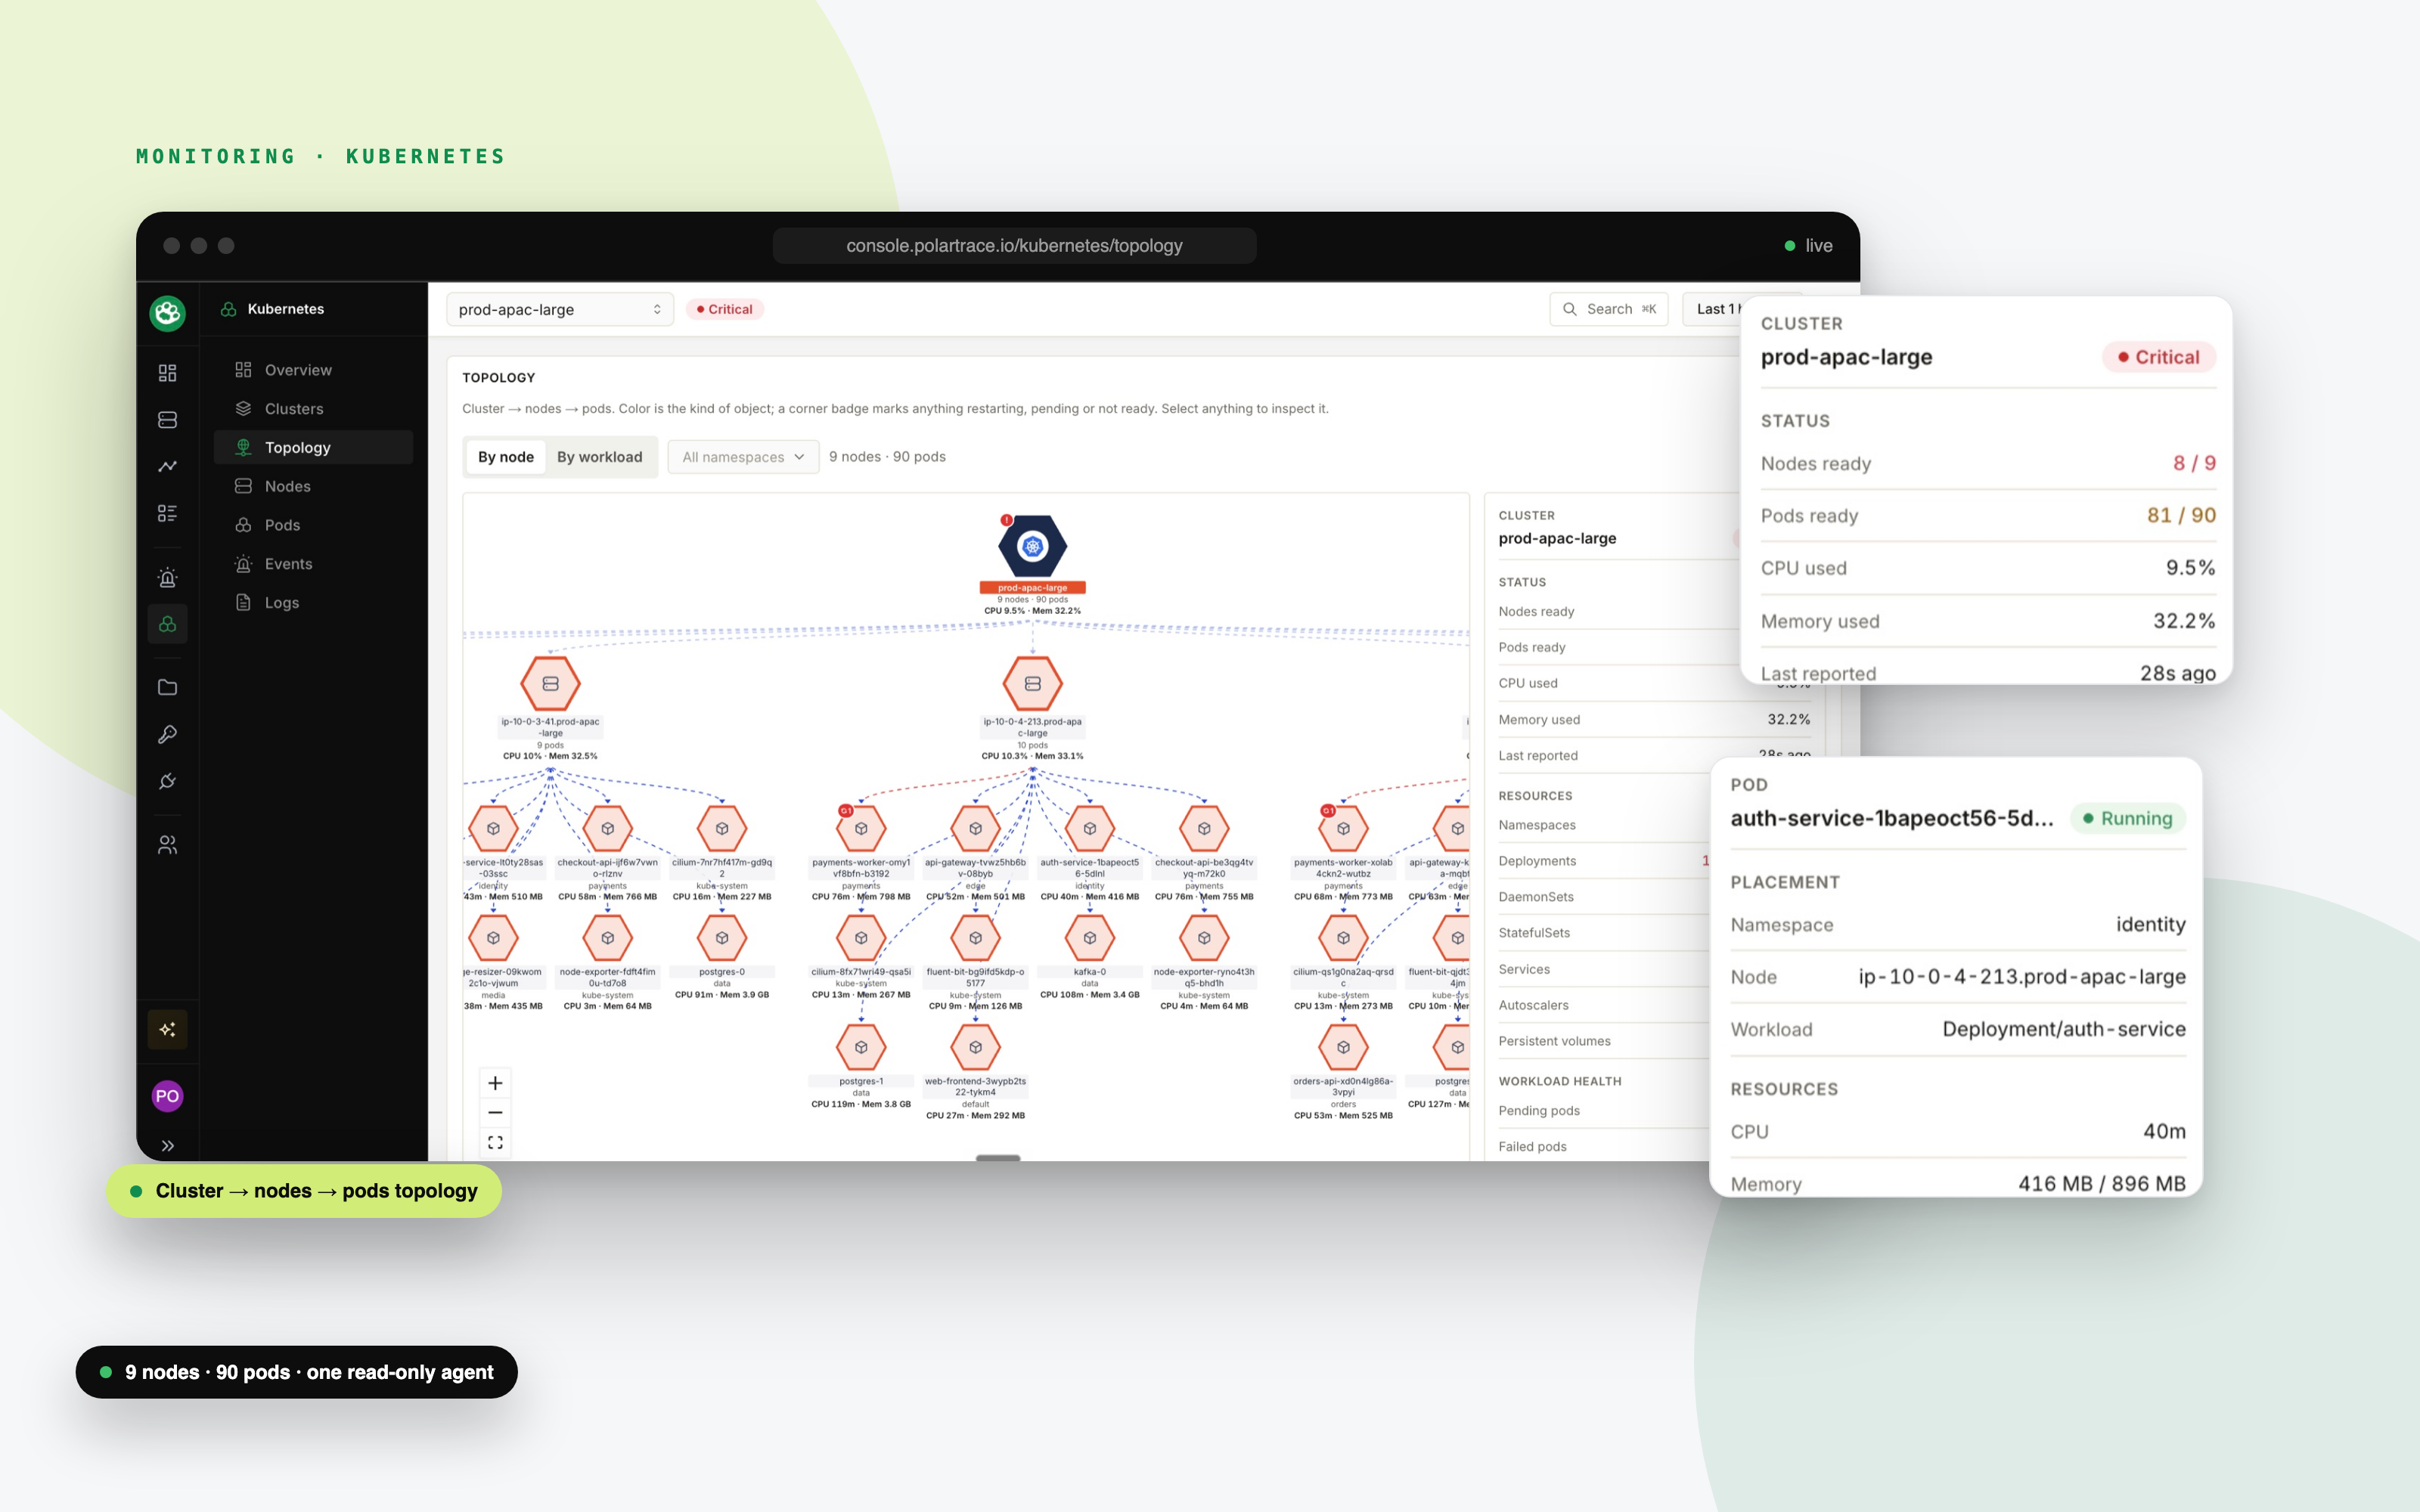
Polartrace Kubernetes topology for prod-apac-large: cluster, nodes and pods graph with status panels

Kubernetes

Cluster health beside your services.

The cluster agent snapshots nodes, pods, containers, workloads and HPA state, streams Kubernetes events with warning reasons, and can collect container logs for namespaces you opt in. Setup is guided from the console's integration wizard.

  • Overview, clusters, topology, nodes, pods, events and logs tabs
  • Restarts, pressure conditions, capacity vs usage
  • Warning events grouped by reason
Learn more

Under the hood

How Polartrace sees your system

Six views the console gives you, drawn in line. Point at one to explore it.

  • Distributed tracing

    Every hop, traced.

    One request followed from service to service, each hop timed - OpenTelemetry context propagation joins the spans for you.

  • Request logs

    Scroll back to the line that matters.

    Every request logged with method, path, status and duration - and on Node.js, its console output alongside.

  • Errors

    Open the frame that failed.

    On Node.js, exceptions arrive with their stack and the trace ID of the request that raised them.

  • Host & runtime metrics

    Every instance accounted for.

    CPU, memory, host load and Node.js event-loop lag, sampled by the same agent that traces your requests.

  • Service dependencies

    Know the blast radius.

    A per-service dependency graph shows what calls what, so a slow database reads as more than one red line.

  • Access control

    Every team, its own keys.

    Custom-role RBAC on Pro, and an audit log of every monitor edit, key rotation and invite.

One signal graph

All your signals.One place to look.

Traces, request logs, host metrics, Kubernetes health and alerts land in one console - already connected, so nobody tabs between four tools to answer “what broke?”.

  • Traces, logs & metrics unified per service
  • Alerts that deep-link to the evidence
  • Kubernetes health beside your services
  • Live in two commands - no YAML
  • Traces
  • Request logs
  • Host metrics
  • Kubernetes
  • Alerts

Polartrace console

30.4k

requests/h - traced, logged and monitored across 12 services

From alert to root cause

See beyond the alert.Fix the exact query.

The alert links to the breach. The trace shows the database call that timed out. The request log carries the error and its stack. Minutes from page to patch - before customers notice.

  • Alerts deep-link into the console
  • Span waterfall with real timings
  • Log ↔ trace correlation
  • Recovery notified automatically
p99 latency · payments-api1.24 s · breach > 800 ms

trace 4f2a91

waterfall

  • checkout-api · POST /checkout1.32 s
  • payments-api · charge1.24 s
  • PostgreSQL · UPDATE payments1.18 s

request log

Node.js

ERROR payment gateway timeout after 1100 ms

trace_id=4f2a91 · stack trace attached

Kubernetes monitoring

See beyond the service.Watch the whole cluster.

The read-only cluster agent snapshots nodes, pods, workloads and HPA state, and streams Kubernetes events with warning reasons - right beside the services those pods run. Setup is guided from the console's integration wizard.

  • Nodes, pods, workloads & HPA snapshots
  • Events grouped by warning reason
  • Monitors on pod restarts & node health
  • Opt-in container log collection
prod-cluster4 nodes · 38/40 pods

Cluster health

Nodes ready
4 / 4
Restarts (1h)
3
CPU of capacity
61%

Pods by status

ReadyPendingCrashLoop

Kubernetes events

warnings by reason

  • BackOffpayments-api-7d9fwarning
  • Unhealthycheckout-api-5c2awarning
  • Scheduledinventory-api-9b1enormal

Integration ecosystem

Polartrace plays well with your stack

Node.js and Python agents built on OpenTelemetry, auto-instrumenting Express, Fastify, Koa, NestJS, Flask, FastAPI and Django - plus MongoDB, PostgreSQL, Redis, Kubernetes and Slack. No YAML week.

  • PostgreSQL
  • MongoDB
  • Redis
  • Express
  • Fastify
  • NestJS
  • Koa
  • Flask
  • FastAPI
  • Django
  • OpenTelemetry

Compare

One plan, two meters. Three vendors, one table.

Same core products - APM & tracing, logs, infrastructure. The difference is the invoice. List price to list price against Datadog and New Relic, verified October 2026.

PolartracevsDatadogvsNew Relic

Three reference workloads, list price to list price

Monthly, at each vendor's published list rates. Hosts, data and team size as stated per row.

WorkloadPolartraceDatadogNew Relic
Starter5 hosts · 30 GB/mo · 3 engineers$89Starter $29 + 3 × $20 flat~$259Polartrace ≈ 66% less~$208Standard · Polartrace ≈ 57% less
Growth20 hosts · 100 GB/mo · 8 engineers$399Growth $99 + 15 × $20 flat~$1,015Polartrace ≈ 61% less~$2,792Pro, annual · Polartrace ≈ 86% less
Pro50 hosts · 500 GB/mo · 15 engineers$1,099Pro $299 + 40 × $20 flat~$2,775Polartrace ≈ 60% less~$5,395Pro, annual · Polartrace ≈ 80% less

Datadog: annual list, verified October 2026 - Infrastructure Pro $15/host, APM $31/host attached to it, log ingest $0.1/GB plus 15-day indexing at $1.7 per million events (about 2 KB per event assumed). New Relic: verified October 2026 - every engineer as a full-platform user on the cheapest edition that admits the team (Standard: $10 first user, $99 each additional, max 5; Pro: $349/user annual), data over the free 100 GB at $0.4/GB, hosts free. Polartrace: current published plan prices and the flat $20 extra-host rate.

Free plan: 5 GB/month - never billed

A platform fee and two meters. That's the whole model.

Every plan includes tracing, logs, metrics, Kubernetes and alerting. You pay for data and hosts past your allowance - at rates printed on the pricing page, with a spend cap you set.

No card required · every rate published · first overage invoice waived

Running Datadog or New Relic today? See what the same workload costs here

Schedule a demo

See Polartrace on your stack.

Thirty minutes with the team that builds it. Tell us when works for you and what you run - we'll come prepared.

Opens our Calendly page in a new tab - pick a 30-minute slot in your timezone, no account needed.

A 30-minute call, on your agenda

  • A live walkthrough of the console
  • Pricing, plans and what your workload would cost
  • Migration questions - including from Datadog or New Relic

Prefer to skip the call? The free plan is 5 GB/month, never billed - two commands and you're live.